


Find new investment opportunities based on Market Sentiment Indicator. Manage watchlist risk with leading indicator of volatility See what influential analysts and investors are saying about stocks in My Watchlist

Transocean
$5.32
+4.72%
Set Alerts
Overview
Comments
Insights
Risks
Rating
Chart
Analysts
Street
Sentiment
Signals
Most Trending
+2.35%
-8.73%
-10.59%
-26.85%
RIG
Transocean
$5.32
Set Alerts
Overview
Comments
Insights
Risks
Rating
Chart
Analysts
Street
Sentiment
Signals

52W High
$7.66
MKT CAP
$5.94B
52W Low
$2.72
VOL
$62.75M
P/E Ratio
N/A
AVG VOL
$41.27M
RSI
51.35
TREND
Sideways
RIG Stock IQ

Login to see Transocean (RIG) Stock IQ rating
Get instant clarity on whether to Buy, Hold, or Avoid.
Strengths

Upgraded on attractively valued
Technical Indicators

Crossed Above 200 DMA
RIG Price Performance
$5.02 (+5.98%)
$6.23 (-14.61%)
$6.17 (-13.78%)
$6.17 (-13.78%)
1year
6month
3month
1month
RIG Analysts Opinion
Overall standing based on market and analyst consensus.
![]() Hover over the category for more information
Hover over the category for more information
Earnings
×
Earnings
Rating
×
Rating
Upgraded on attractively valued
Momentum
×
Momentum
Activity
×
Activity
Future
×
Future

RIG Analysts opinion is negative but has improved from the past 3 months
RIG Street Sentiment
Analysts perspectives on the stock desirability, trend direction and growth potential
43%
Consensus Rating
0%
Buy
Opinion
Opinion
NA
Trend
Score
Score
NA
Potential
Score
Score

RIG Street Sentiment is bullish and have negative views on the near-term outlook
RIG Risk Level
RIG has Low risk level

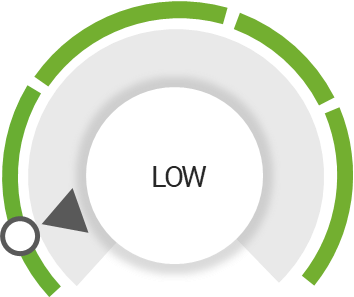
Low
LOW
HIGH
RIG Performance Sentiment
Sentiments overview associated with events and the stock performance
43%
Positive
3 out of 7
events present
events present
29%
Negative
2 out of 7
events present
events present
Very Bullish
Bullish
Neutral
Bearish
Very Bearish
Analyst Consensus
Recent Upgrades and Downgrades
100%
Consensus Rating
3
Buy
0
Hold
0
Sell
Date
Action
Rating
Firm
May 22, 2026
Upgrade
Overweight
Barclays
May 20, 2026
Upgrade
Overweight
Bernstein
RIG Trading Signals +
FAQ About RIG Stock Insights
What is RIG current stock price?
What is RIG current Stock IQ?
What is RIG RSI signal right now?
What is RIG analyst price target and upside potential?
What do analysts say about RIG stock?
What is RIG momentum trend right now?
What are RIG stock strengths?
What is RIG Risk Level?
Should I buy RIG stock right now?
Is RIG a Strong Buy right now?
What is RIG market cap and volume?
What factors influence RIG's Stock IQ?
Explore our RIG Stock insights
- In-Depth Market Analysis and Trends
- Expert Insights on Market Dynamics
- Tailored RIG Stock Strategies
- Effective Risk Management
FIND US ON


Receive our RIG Daily Alerts
Join our subscribers who value exclusive insights. Stay ahead in the stock market! Enter your email for daily alerts
Market Trends
Investment Insights
Stock Analysis
About StocksRunner
Stay ahead of the market
Market trends
Investment tips
Market analysis service
Future potential
Informed investment decisions
Investment analysis
IInvestment strategies
In-depth stock analysis
Performance analysis
Stock market insights
Financial trends analysis