Find new investment opportunities based on Market Sentiment Indicator. Manage watchlist risk with leading indicator of volatility See what influential analysts and investors are saying about stocks in My Watchlist
Most Trending
+6.87%
+0.83%
+1.37%
+5.22%
+2.26%
ESNT
Essent Group
$62.75
Strengths

Investors confidence is positive

Expands stock buyback program
Risk Analysis

Earnings are forecast to decrease
Chart
$59.69 (+5.13%)
$63.8 (-1.65%)
$59.87 (+4.81%)
$55.5 (+13.06%)
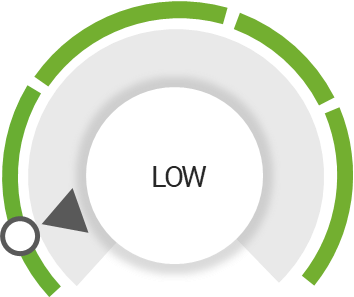
ESNT has Low risk level based on volatility, sector strength, volume, investor confidence, and outlook.
Click here to check what is your level of risk
Risks Indicators

Investors losing confidence

ESNT overall standing based on key factors, offering insights into analysts perspectives and market expectations.
Hover over the category for more information
Earnings
Earnings

Below analyst estimate

Revenue increase YoY
Rating
Rating
Momentum
Momentum

Has been gaining momentum
Activity
Activity

Investors confidence is positive

Expands stock buyback program
Future
Future

Earnings are forecast to decrease
![]()
ESNT Analysts opinion is negative and it remained unchanged from the past 3 months
Analysts perspectives on the stock desirability, trend direction, and growth potential.
ESNT Street Sentiment is extremely bullish and have positive views on the near-term outlook
What is ESNT current stock price?
What are ESNT stock strengths?
What is ESNT Risk Level?
What is ESNT market cap and volume?
What is ESNT current Stock IQ?
Should I buy ESNT stock right now?
Is ESNT a Strong Buy right now?
What does a 'Strong Buy' rating mean for ESNT?
What does a 'Strong Sell' rating mean for ESNT?
What factors influence ESNT's Stock IQ?
Join over 10,000+ subscribers who value exclusive insights. Stay ahead in the stock market! Enter your email for daily alerts
Stay ahead of the market
Market trends
Investment tips
Market analysis service
Future potential
Informed investment decisions
Investment analysis
IInvestment strategies
In-depth stock analysis
Performance analysis
Stock market insights
Financial trends analysis
Most Trending
+6.87%
+0.83%
+1.37%
+5.22%
+2.26%
ESNT
Essent Group
Current Price
$62.75
Stock Insights
Strengths

Investors confidence is positive

Expands stock buyback program
Risk Analysis

Earnings are forecast to decrease

Chart
$59.69 (+5.13%)
$63.8 (-1.65%)
$59.87 (+4.81%)
$55.5 (+13.06%)
ESNT Analysts Opinion
ESNT Overall standing by considering key factors, reflecting analysts perspectives and market expectations.
Hover over the category for more information
Earnings
Earnings

Below analyst estimate

Revenue increase YoY
Rating
Rating
Momentum
Momentum

Has been gaining momentum
Activity
Activity

Investors confidence is positive

Expands stock buyback program
Future
Future

Earnings are forecast to decrease
![]()
ESNT Analysts opinion is negative and it remained unchanged from the past 3 months
Analysts perspectives on the stock desirability, trend direction, and growth potential.
ESNT Street Sentiment is extremely bullish and have positive views on the near-term outlook
ESNT has Low risk level based on volatility, sector strength, volume, investor confidence, and outlook.
Click here to check what is your level of risk
Risks Indicators

Investors losing confidence
ESNT Latest Analysis
Scott Bessent Says Americans Set For Lowest Cost Thanksgiving Dinner In 4 Years After Being Traumatized By Biden-Era Prices. Treasury Secretary consumer price increases and forecasting relief for American households ahead of the holidays.On Sunday Bessent said “.We are starting to see the affordability”. while speaking on NBC’.s “.Meet The Press”. noting that economic conditions have been improving significantly under President “.We'.re having Thanksgiving week.
Today
Bessent sees strong 2026 ahead despite $11 billion shutdown hit . The United States economy took an $11 billion hit from the prolonged government shutdown but officials remain optimistic about strong growth in 2026 as inflation eases energy prices fall and new tax and trade measures support demand. A temporary slowdown is expected in the near term but improving housing data and policy actions point to a stronger year ahead.
Today
Scott Bessent Compares $20 Trillion In Investments Under Trump With Bidens $1 Trillion In 4 Years Says President Laying Foundation Of Golden Age. Treasury Secretary Discussing Trump’.s claims of generating “.$20 trillion in terms of total investments for the country Bessent said he believes these commitments “.are real.”. He pointed to a mix of corporate and international plans driving the total describing them as “.investments like we'.ve never seen.”.Bessent c
Thu Nov 20, 2025
Trump Promises New Stimulus Checks — Could SPY AAPL NVDA And TSLA Be Big Winners Again?. Millions of Americans could be getting stimulus checks of $2000 or more according to President Here'.s a look back at how consumers who chose to invest their three stimulus checks from 2020 and 2021 into stocks previously did.have been given many titles including Trump referring to them as tariff dividend checks related to income from tariffs charged on other countries for goods they export to the countr
Wed Nov 19, 2025
Essent Group signals continued high capital returns with $500M new buyback authorization and $0.31 dividend amid robust cash flows.
Fri Nov 7, 2025
Essent Group GAAP EPS of $1.67 misses by $0.09 revenue of $311.83M misses by $4.92M.
Fri Nov 7, 2025
Essent Group declares $0.31 dividend.
Fri Nov 7, 2025
Essent Group Ltd. Announces Third Quarter 2025 Results and Declares Quarterly Dividend. Essent Group Ltd. Announces Third Quarter 2025 Results and Declares Quarterly Dividend
Fri Nov 7, 2025
FIND US ON
Unlock the knowledge that 10,000+ subscribers already cherish. Join for exclusive insights and stay ahead in the stock game! Enter your email to receive daily alerts
In-depth stock analysis
Informed investment decisions
Stock market insights
Stock trading tips
ESNT Stock trends
ESNT Stock performance
ESNT Stock analysis
ESNT investment strategies
Disclaimer:
Past performance, whether from actual results or historical strategy tests, does not guarantee future success. The displayed outcomes are based on strategies not previously available to investors and do not depict the returns achieved by any specific investor.
The Readiness Indicators, Sentiment Indicators, and overall score are derived from a model retrospectively applied using historical data. This model relies on assumptions inherent to it, which may or may not be verifiable and carry potential risks, including losses.
Engaging in active trading may not be suitable for individuals with limited resources, minimal investment or trading experience, or a low-risk tolerance. Proceed with caution as your capital is exposed to risks.
Please note that no offer or solicitation to buy or sell securities, securities derivatives of future products of any kind, or any type of trading or invesment advise, recommendation or strategy, is made, given or endorsed by StocksRunner including any of their affiliates ("TS").
This information is provided for illustrative purposes only. You should not rely on any advice and/or information contained in this website and before making any investment decision. we recommend that you consider whether it is appropriate for your situation and seek appropriate financial, taxation and legal advice.