StocksRunner logo
mail
search
 
menu
 
Vertex Pharma
495.26
+0.61%
 
StocksRunner
  Overview  
  
StocksRunner
  Analysis  
  
StocksRunner
     Risks     
  
StocksRunner
  Rating  
  
StocksRunner
     Chart     
  
StocksRunner
  Analysts  
  
StocksRunner
  Street  
  
StocksRunner
  Sentiment  
  
StocksRunner
  Earnings  
  
StocksRunner
  Headlines  
 
Downgrades


VRTX


Vertex Pharma

$495.26

 
+$3.00 | +0.61%
 

Stock Viewers 1737


StocksRunner
  Overview  
  
StocksRunner
  Analysis  
  
StocksRunner
     Risks     
  
StocksRunner
  Rating  
  
StocksRunner
     Chart     
  
StocksRunner
  Analysts  
  
StocksRunner
  Street  
  
StocksRunner
  Sentiment  
  
StocksRunner
  Earnings  
  
StocksRunner
  Headlines  
 
 
Open
$ 493.14
 
 
MKT CAP
$ 127.80B
 
High
$ 502.97
 
 
VOL
$ 556.92K
 
Low
$ 492.17
 
 
AVG VOL
$ 1.16M


VRTX Stock Rating Review

 
lock  Login to display Vertex Pharma (VRTX) recommendation from the last 90 days from financial news and social media.


VRTX Total Score


Strengths

VRTX Rewards

 Earnings are forecast to grow

VRTX Rewards

 Outperform the market

VRTX Rewards

 Upgraded on attractively valued

VRTX Rewards

 Investors confidence is positive


Chart


480.73

400.16

411.38

354.05


1month
3month
6month
1year
 
Total Return
VRTX
vs.
S&P500


1-week Return
-0.13%
 
-1.89%
 
 
5-week Return
+5.66%
 
-0.10%
 
 
10-week Return
+13.20%
 
+2.84%


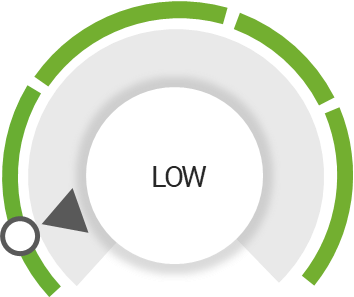
VRTX Risk Level


This Indicator assigning VRTX risk levels based on factors such as volatility, sector strength, trading volume, investor confidence and market outlook.

 
VRTX Risk Level
LOW
HIGH

Risk Volatility


VRTX has Low Risk Level

Click here to check what is your level of risk


VRTX Analysts Opinion


VRTX overall standing based on key factors, offering insights into analysts perspectives and market expectations.
menu Hover over the category for more information


Earnings

×
 

Earnings

5.00
 

VRTX Earnings Sentiment

 Revenue increase YoY

VRTX Earnings Sentiment

 Above analyst estimates


Rating

×
 

Rating

5.00
 

VRTX Rating Sentiment

 Upgraded on attractively valued


Momentum

×
 

Momentum

3.50


Activity

×
 

Activity

3.90
 

VRTX Activity Sentiment

 Investors confidence is positive


Future

×
 

Future

3.70
 

VRTX Future Sentiment

 Earnings are forecast to grow

VRTX Future Sentiment

 Outperform the market


VRTX Analysts Opinion

VRTX Analysts opinion is positive and also has improved from the past 3 months


VRTX Street Consensus


Analysts perspectives on the stock desirability, trend direction, and growth potential.

 
89%
Buy
Opinion
Trend
Score
Potential
Score
 
Consensus Rating
 
100%
75%
80%
 

VRTX Street Opinion 

VRTX Street view is extremely ish and have positive views on the near-term outlook


VRTX Performance Sentiment

 
Sentiments overview associated with VRTX events and the stock performance.
 
89%
8%
Positive
Negative
34 out of 38
events present
3 out of 38
events present
 
Very Bullish
Bullish
Neutral
Bearish
Very Bearish
 

VRTX Earnings


The TTM reflects 12-month period, providing review of VRTX financial performance.

 
Millions of Dollars
TTM
2023
2022
CAGR


Total Revenue
10,185
9,869
8,931
+6.79%
 
 
Cost of Revenue
1,338
1,262
1,080
+11.31%
 
 
Gross Profit
8,847
8,607
7,850
+6.16%
 
 
Operating Exp
4,448
4,300
3,485
+12.97%
 
 
Operating Inc
4,400
4,308
4,365
+0.40%
 
 
Net Interest Inc
630
571
90
+164.58%
 
 
Interest Exp
43
44
55
-11.58%
 
 
Interest Inc
673
615
145
+115.44%
 
 
Other Inc Exp
-262
-498
-223
-
 
 
EPS Growth
-


VRTX Financial Health


The company financial health has significantly improved over the past year, reflecting strong market demand and effective business strategies. Enhanced profitability and efficient cost management have contributed to this positive trend. The transition from a loss to profitability indicates a solid turnaround in operations, supported by better financial management.


Financial Score

 
3.65
 
Next Earnings Date: Jul 30, 2024
 
 
Linked to VRTX
Total Score
Close Price
% Change


WDAY

Workday

4.00

228.64

+0.69%


DTST

Data Storage

N/A

5.37

-1.29%


DDOG

Datadog

4.19

118.31

-1.66%


Headlines
Last Modify
Price
% Change

 
Buy Rating
This Week
490.80
+0.10%
 
HR Activity
1 Week Ago
488.37
-0.12%
 
Agreements
1 Week Ago
488.98
-0.38%
 
Price Target Reached
1 Week Ago
490.85
+0.43%
 
Approvals
3 Weeks Ago
470.28
-0.74%
 
 
VRTX Latest Updates +


StocksRunner

Explore our VRTX Stock insights

  • In-Depth Market Analysis and Trends
  • Expert Insights on Market Dynamics
  • Tailored VRTX Stock Strategies
  • Effective Risk Management
 

FIND US ON

StocksRunner on Facebook StocksRunner on Twitter StocksRunner on YouTube StocksRunner on stocktwits StocksRunner Rss
 

Receive our VRTX Daily Alerts

Access the exclusive insights that over 10,000+ subscribers value. Stay ahead in the stock market! Submit your email for daily alerts.

 
Market Trends

Stay ahead of the market

Market trends

Investment tips

Market analysis service

 
Investment Insights

Future potential

Informed investment decisions

Investment analysis

IInvestment strategies

 
Stock Analysis

In-depth stock analysis

Performance analysis

Stock market insights

Financial trends analysis

 
About StocksRunner

Log In

Sign Up

Contact Us

Terms of use

Privacy Policy


Disclaimer: The Score performance whether actual or indicated by historical tests of strategies, is no guarantee of future performance or success. The results reflect performance of a strategy not historically offered to investors and does not represent returns that any investor actually attained. The results reflect performance of a strategy not historically offered to investors and does not represent returns that any investor actually attained. The Readiness Indicators, Sentiment Indicators and total score are calculated by the retroactive application of a model constructed on the basis of historical data and based on assumptions integral to the model which may or may not be testable and are subject to losses. Active trading is generally not appropriate for someone of limited resources, limited invesment or trading experience, or low-risk tolerance. Your capital may be at risk.

Please note that no offer or solicitation to buy or sell securities, securities derivatives of future products of any kind, or any type of trading or invesment advise, recommendation or strategy, is made, given or endorsed by StocksRunner including any of their affiliates ("TS").

This information is provided for illustrative purposes only. You should not rely on any advice and/or information contained in this website and before making any investment decision. we recommend that you consider whether it is appropriate for your situation and seek appropriate financial, taxation and legal advice.


StocksRunner logo

StocksRunner

Get the pulse of the market


StocksRunner
 
 
StocksRunner
Overview
 
StocksRunner
Trending
 
StocksRunner
Screener
 
StocksRunner
Ideas
 
StocksRunner
Top Rated
 
StocksRunner
Momentum
 
StocksRunner
Earnings
 
Top Banner
 
StocksRunner
  Overview  
  
StocksRunner
  Analysis  
  
StocksRunner
   Risks   
  
StocksRunner
  Rating  
  
StocksRunner
  Chart  
  
StocksRunner
  Analysts  
  
StocksRunner
  Street  
  
StocksRunner
  Sentiment  
  
StocksRunner
  Earnings  
  
StocksRunner
  Headlines  


Stock Insights


Strengths


VRTX Rewards

 Earnings are forecast to grow

VRTX Rewards

 Outperform the market

VRTX Rewards

 Upgraded on attractively valued

VRTX Rewards

 Investors confidence is positive


VRTX Risk Level


The Indicator assigning VRTX risk levels based on factors such as volatility, sector strength, trading volume, investor confidence and market outlook.


VRTX Risk Level
LOW
HIGH

Risk Volatility


VRTX has Low Risk Level. Click here to check what is your level of risk


VRTX


Vertex Pharma

$495.26

 
+$3.00 | +0.61%
 

Stock Viewers 1737


Open
$ 493.14
 
 
MKT CAP
$ 127.80B
 
High
$ 502.97
 
 
VOL
$ 556.92K
 
Low
$ 492.17
 
 
AVG VOL
$ 1.16M


VRTX Stock Rating

 
lock  Login to view Vertex Pharma (VRTX) recommendation from the last 90 days from financial news and social media.


Chart


480.73

400.16

411.38

354.05


1month
3month
6month
1year
 
Total Return
VRTX
vs.
S&P500


1-week Return
-0.13%
 
-1.89%
 
 
5-week Return
+5.66%
 
-0.10%
 
 
10-week Return
+13.20%
 
+2.84%


VRTX Analysts Opinion


VRTX Overall standing by considering key factors, reflecting analysts perspectives and market expectations.
menu Hover over the category for more information


Earnings

×
 

Earnings

5.00
 

VRTX Earnings Sentiment

 Revenue increase YoY

VRTX Earnings Sentiment

 Above analyst estimates


Rating

×
 

Rating

5.00
 

VRTX Rating Sentiment

 Upgraded on attractively valued


Momentum

×
 

Momentum

3.50


Activity

×
 

Activity

3.90
 

VRTX Activity Sentiment

 Investors confidence is positive


Future

×
 

Future

3.70
 

VRTX Future Sentiment

 Earnings are forecast to grow

VRTX Future Sentiment

 Outperform the market


VRTX Analysts Opinion

VRTX Analysts opinion is positive and also has improved from the past 3 months


VRTX Street Consensus


Analysts perspectives on the stock desirability, trend direction, and growth potential.

 
89%
Buy
Opinion
Trend
Score
Potential
Score
 
Consensus Rating
 
100%
75%
80%
 

VRTX Street Opinion 

VRTX Street view is extremely ish and have positive views on the near-term outlook

 
VRTX Performance Sentiment
 
Sentiments overview associated with VRTX events and the stock performance.
 
89%
8%
Positive
Negative
34 out of 38
events present
3 out of 38
events present
 
Very Bullish
Bullish
Neutral
Bearish
Very Bearish
 

VRTX Earnings


The TTM data reflects the most recent 12-month period, providing overview of VRTX financial performance.

 
Millions of Dollars
TTM
2023
2022
CAGR


Total Revenue
10,185
9,869
8,931
+6.79%
 
 
Cost of Revenue
1,338
1,262
1,080
+11.31%
 
 
Gross Profit
8,847
8,607
7,850
+6.16%
 
 
Operating Exp
4,448
4,300
3,485
+12.97%
 
 
Operating Inc
4,400
4,308
4,365
+0.40%
 
 
Net Interest Inc
630
571
90
+164.58%
 
 
Interest Exp
43
44
55
-11.58%
 
 
Interest Inc
673
615
145
+115.44%
 
 
Other Inc Exp
-262
-498
-223
-
 
 
EPS Growth
-


VRTX Financial Health


The company financial health has significantly improved over the past year, reflecting strong market demand and effective business strategies. Enhanced profitability and efficient cost management have contributed to this positive trend. The transition from a loss to profitability indicates a solid turnaround in operations, supported by better financial management.


Financial Score

 
3.65
 
Next Earnings Date: Jul 30, 2024
 
Headlines
Last Modify
Price
% Change

 
Buy Rating
This Week
490.80
+0.10%
 
HR Activity
1 Week Ago
488.37
-0.12%
 
Agreements
1 Week Ago
488.98
-0.38%
 
Price Target Reached
1 Week Ago
490.85
+0.43%
 
Approvals
3 Weeks Ago
470.28
-0.74%
 
 
VRTX Latest Updates +


Score Analyzer


Based on 38 events in the last 90 days from financial news and social media. Last updated Jul 26, 2024 19:56 Wall St. time


VRTX Total Score


StocksRunner

Discover VRTX Stock analysis and effective trading strategies with StocksRunner. Gain valuable insights into stock performance, market trends, and the future potential of VRTX. We're here to help you make informed investment decisions today.


FIND US ON

StocksRunner on Facebook StocksRunner on Twitter StocksRunner on YouTube StocksRunner on stocktwits StocksRunner Rss


Receive our VRTX Daily Alerts

Unlock the knowledge that 10,000+ subscribers already cherish. Join for exclusive insights and stay ahead in the stock game! Enter your email to receive daily alerts

 
Market trends

In-depth stock analysis

Informed investment decisions

Stock market insights

Stock trading tips

Stock analysis

VRTX Stock trends

VRTX Stock performance

VRTX Stock analysis

VRTX investment strategies

Stock strategies

Trading strategies

StocksRunner updates

StocksRunner ideas

Financial Reports


Disclaimer: Past performance, whether from actual results or historical strategy tests, does not guarantee future success. The displayed outcomes are based on strategies not previously available to investors and do not depict the returns achieved by any specific investor. The Readiness Indicators, Sentiment Indicators, and overall score are derived from a model retrospectively applied using historical data. This model relies on assumptions inherent to it, which may or may not be verifiable and carry potential risks, including losses. Engaging in active trading may not be suitable for individuals with limited resources, minimal investment or trading experience, or a low-risk tolerance. Proceed with caution as your capital is exposed to risks.

Please note that no offer or solicitation to buy or sell securities, securities derivatives of future products of any kind, or any type of trading or invesment advise, recommendation or strategy, is made, given or endorsed by StocksRunner including any of their affiliates ("TS").

This information is provided for illustrative purposes only. You should not rely on any advice and/or information contained in this website and before making any investment decision. we recommend that you consider whether it is appropriate for your situation and seek appropriate financial, taxation and legal advice.


Post ×
 
0/666
joker