

Find new investment opportunities based on Market Sentiment Indicator. Manage watchlist risk with leading indicator of volatility See what influential analysts and investors are saying about stocks in your watchlist


Overview

Analysis

Risks

Rating

Chart

Analysts

Street

Sentiment

Earnings
Headlines

ORAN
Orange
$11.17
 1115
1115
Overview
Analysis
Risks
Rating
Chart
Analysts
Street
Sentiment
Earnings
Headlines
ORAN Stock Rating Review
 Login to display Orange (ORAN) recommendation from the last 90 days from financial news and social media.
ORAN Total Score
Chart
9.88
11.22
11.51
11.43
ORAN Risk Level
This Indicator assigning ORAN risk levels based on factors such as volatility, sector strength, trading volume, investor confidence and market outlook.
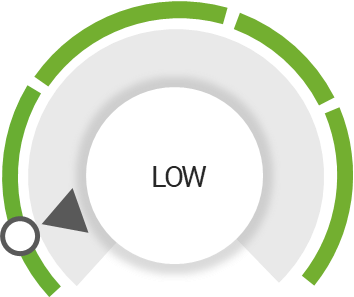
Risk Volatility
ORAN has Low Risk Level
Click here to check what is your level of risk
ORAN Analysts Opinion
ORAN overall standing based on key factors, offering insights into analysts perspectives and market expectations.
 Hover over the category for more information
Earnings
Earnings

Revenue increase YoY
Rating
Rating
Momentum
Momentum

Price value has negative momentum
Activity
Activity
Future
Future

ORAN Analysts opinion is negative and it remained unchanged from the past 3 months
ORAN Street Consensus
Analysts perspectives on the stock desirability, trend direction, and growth potential.
Opinion
Score
Score

ORAN Street view is bullish and have negative views on the near-term outlook
ORAN Performance Sentiment
events present
events present
Bullish
Neutral
Bearish
Very Bearish
ORAN Earnings
The TTM reflects 12-month period, providing review of ORAN financial performance.
ORAN Financial Health
The company financial health has moderately improved over the past year, reflecting average market demand and somewhat effective business strategies. There have been noticeable gains in profitability and cost management, but there is still substantial room for growth and optimization.
Financial Score
Explore our ORAN Stock insights
- In-Depth Market Analysis and Trends
- Expert Insights on Market Dynamics
- Tailored ORAN Stock Strategies
- Effective Risk Management
FIND US ON


Receive our ORAN Daily Alerts
Access the exclusive insights that over 10,000+ subscribers value. Stay ahead in the stock market! Submit your email for daily alerts.
Stay ahead of the market
Market trends
Investment tips
Market analysis service
Future potential
Informed investment decisions
Investment analysis
IInvestment strategies
In-depth stock analysis
Performance analysis
Stock market insights
Financial trends analysis
Disclaimer:
The Score performance whether actual or indicated by historical tests of strategies, is no guarantee of future performance or success. The results reflect performance of a strategy not historically offered to investors and does not represent returns that any investor actually attained.
The results reflect performance of a strategy not historically offered to investors and does not represent returns that any investor actually attained.
The Readiness Indicators, Sentiment Indicators and total score are calculated by the retroactive application of a model constructed on the basis of historical data and based on assumptions integral to the model which may or may not be testable and are subject to losses.
Active trading is generally not appropriate for someone of limited resources, limited invesment or trading experience, or low-risk tolerance. Your capital may be at risk.
Please note that no offer or solicitation to buy or sell securities, securities derivatives of future products of any kind, or any type of trading or invesment advise, recommendation or strategy, is made, given or endorsed by StocksRunner including any of their affiliates ("TS").
This information is provided for illustrative purposes only. You should not rely on any advice and/or information contained in this website and before making any investment decision. we recommend that you consider whether it is appropriate for your situation and seek appropriate financial, taxation and legal advice.


