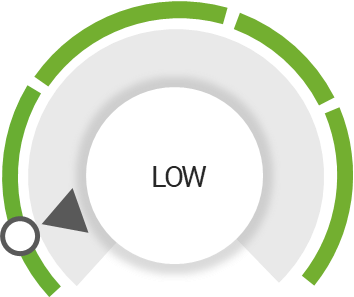
Find new investment opportunities based on Market Sentiment Indicator. Manage watchlist risk with leading indicator of volatility See what influential analysts and investors are saying about stocks in your watchlist
Most Trending
Fox Corporation
Summary
Chart
29.04
28.99
31.35
28.92
Strengths
Earnings are forecast to grow
Earnings
×Earnings
Rating
×Rating
Momentum
×Momentum
Activity
×Activity
Future
×Future
Earnings are forecast to grow
Analysts opinion is negative and it remained unchanged from the past 3 months
Street view is bullish and have negative views on the near-term outlook
Tue Nov 14, 2023
Thu Oct 26, 2023
Wed Oct 25, 2023
Fri Oct 6, 2023
Receive FOX Daily Alerts
Enter your email to receive daily alerts
Stay ahead of the market
Market trends
Investment tips
Market analysis service
Future potential
Informed investment decisions
Investment analysis
IInvestment strategies
In-depth stock analysis
Performance analysis
Stock market insights
Financial trends analysis
Disclaimer:
The Score performance whether actual or indicated by historical tests of strategies, is no guarantee of future performance or success. The results reflect performance of a strategy not historically offered to investors and does not represent returns that any investor actually attained.
The results reflect performance of a strategy not historically offered to investors and does not represent returns that any investor actually attained. The Readiness Indicators, Sentiment Indicators and total score are calculated by the retroactive application of a model constructed on the basis of historical data and based on assumptions integral to the model which may or may not be testable and are subject to losses. Active trading is generally not appropriate for someone of limited resources, limited invesment or trading experience, or low-risk tolerance. Your capital may be at risk.
Please note that no offer or solicitation to buy or sell securities, securities derivatives of future products of any kind, or any type of trading or invesment advise, recommendation or strategy, is made, given or endorsed by StocksRunner including any of their affiliates ("TS").
This information is provided for illustrative purposes only. You should not rely on any advice and/or information contained in this website and before making any investment decision. we recommend that you consider whether it is appropriate for your situation and seek appropriate financial, taxation and legal advice.
Most Trending
Economic Data
Previous
2%
Forecast
4.90%
Previous
0.30%
Forecast
0.30%
Previous
209K
Forecast
213K
Previous
0.30%
Forecast
0.30%
Previous
0.70%
Forecast
0.40%
Earnings Report
NTAP
NetApp
+0.03%
78.11
ULTA
Ulta Beauty
+0.77%
417.96
RY
Royal Bank Of Canada
-0.39%
86.42
INTU
Intuit
+0.68%
565.07
CRWD
CrowdStrike Holdings
+1.09%
212.35
HIBB
Hibbett
+1.88%
60.58
HPE
Hewlett Packard
-0.51%
15.52
WDAY
Workday
+0.64%
237.33
ZS
Zscaler
+1.01%
193.85
DG
Dollar General
+1.43%
127.50
CRM
Salesforce
+0.06%
224.92
OKTA
Okta
+3.32%
72.61
XPEV
Xpeng
+0.96%
17.88
Stock Analysis and Insights
Summary
Chart
29.04
28.99
31.35
28.92
Strengths
Earnings are forecast to grow
Earnings
×Earnings
Rating
×Rating
Momentum
×Momentum
Activity
×Activity
Future
×Future
Earnings are forecast to grow
Analysts opinion is negative and it remained unchanged from the past 3 months
Street view is bullish and have negative views on the near-term outlook
Events Calendar
Hover for information
Tue Nov 14, 2023
Thu Oct 26, 2023
Wed Oct 25, 2023
Fri Oct 6, 2023
Market Overview
Based on 4,677 events Last updated Nov 28, 2023 17:07
Trending Stocks
SWTX
SpringWorks Therapeutics
+18.68%
24.65
COIN
Coinbase Global
+7.10%
128.27
NEM
Newmont
+6.26%
40.57
CROX
Crocs
+5.13%
101.09
BA
Boeing
+1.40%
222.37
MSFT
Microsoft
+1.08%
382.70
ZS
Zscaler
+1.01%
193.85
NKE
Nike
+0.74%
108.76
ADBE
Adobe
+0.65%
623.32
GOOG
Alphabet
+0.41%
138.62
FIND US ON
Receive FOX Daily Alerts
Enter your email to receive daily alerts
In-depth stock analysis
Informed investment decisions
Stock market insights
Stock trading tips
Disclaimer:
The Score performance whether actual or indicated by historical tests of strategies, is no guarantee of future performance or success. The results reflect performance of a strategy not historically offered to investors and does not represent returns that any investor actually attained.
The results reflect performance of a strategy not historically offered to investors and does not represent returns that any investor actually attained. The Readiness Indicators, Sentiment Indicators and total score are calculated by the retroactive application of a model constructed on the basis of historical data and based on assumptions integral to the model which may or may not be testable and are subject to losses. Active trading is generally not appropriate for someone of limited resources, limited invesment or trading experience, or low-risk tolerance. Your capital may be at risk.
Please note that no offer or solicitation to buy or sell securities, securities derivatives of future products of any kind, or any type of trading or invesment advise, recommendation or strategy, is made, given or endorsed by StocksRunner including any of their affiliates ("TS").
This information is provided for illustrative purposes only. You should not rely on any advice and/or information contained in this website and before making any investment decision. we recommend that you consider whether it is appropriate for your situation and seek appropriate financial, taxation and legal advice.