Find new investment opportunities based on Market Sentiment Indicator. Manage watchlist risk with leading indicator of volatility See what influential analysts and investors are saying about stocks in My Watchlist
Most Trending
-1.27%
+3.92%
+1.72%
COGT
Cogent Biosciences I
$33.42
Strengths

Upgraded on attractively valued
Chart
$16.2 (+106.30%)
$11.89 (+181.08%)
$7.24 (+361.60%)
$8.98 (+272.16%)
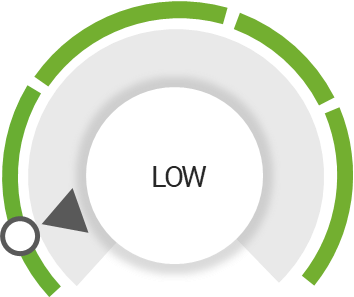
COGT has Low risk level based on volatility, sector strength, volume, investor confidence, and outlook.
Click here to check what is your level of risk
COGT overall standing based on key factors, offering insights into analysts perspectives and market expectations.
Hover over the category for more information
Earnings
Earnings
Rating
Rating

Upgraded on attractively valued
Momentum
Momentum
Activity
Activity
Future
Future
![]()
COGT Analysts opinion is negative and has getting worse from the past 3 months
Analysts perspectives on the stock desirability, trend direction, and growth potential.
COGT Street Sentiment is extremely bullish and have negative views on the near-term outlook
Average key support and resistance price levels.
Login to displayWhat is COGT current stock price?
What are COGT stock strengths?
What risks are associated with COGT stock?
When is COGT next earnings report?
What is COGT market cap and volume?
What is COGT's current Stock IQ?
Should I buy COGT stock right now?
Is COGT a Strong Buy right now?
What does a 'Strong Buy' rating mean for COGT?
What does a 'Strong Sell' rating mean for COGT?
What factors influence COGT's Stock IQ?
Join over 10,000+ subscribers who value exclusive insights. Stay ahead in the stock market! Enter your email for daily alerts
Stay ahead of the market
Market trends
Investment tips
Market analysis service
Future potential
Informed investment decisions
Investment analysis
IInvestment strategies
In-depth stock analysis
Performance analysis
Stock market insights
Financial trends analysis
Most Trending
-1.27%
+3.92%
+1.72%
COGT
Cogent Biosciences I
Current Price
$33.42
Stock Insights
Strengths

Upgraded on attractively valued

Chart
$16.2 (+106.30%)
$11.89 (+181.08%)
$7.24 (+361.60%)
$8.98 (+272.16%)
COGT Analysts Opinion
COGT Overall standing by considering key factors, reflecting analysts perspectives and market expectations.
Hover over the category for more information
Earnings
Earnings
Rating
Rating

Upgraded on attractively valued
Momentum
Momentum
Activity
Activity
Future
Future
![]()
COGT Analysts opinion is negative and has getting worse from the past 3 months
Analysts perspectives on the stock desirability, trend direction, and growth potential.
COGT Street Sentiment is extremely bullish and have negative views on the near-term outlook
COGT has Low risk level based on volatility, sector strength, volume, investor confidence, and outlook.
Click here to check what is your level of risk

Average key support and resistance price levels.
COGT Latest Analysis
Leerink Partners Maintains Cogent Biosciences (COGT) Outperform Recommendation. Fintel reports that on November 10 2025 Leerink Partners maintained coverage of Cogent Biosciences (NasdaqGS:COGT) with a Outperform recommendation. Analyst Price Forecast Suggests 30.87% Downside
Today
Cogent Biosciences (COGT) Climbs to New Record High on Cancer Treatment Drug Trial. We recently published 10 Stocks Beating the Market with Eye-Popping Gains. Cogent Biosciences Inc. (NASDAQ:COGT) is one of the best-performing stocks on Monday. Cogent Biosciences soared to a new seven-year high on Monday as investors cheered promising results of the last clinical trial phase that tested the efficacy of its drug candidate for a type [….]
Today
Cogent Biosciences: Soaring On Blowout GIST Data - I Expect More Upside.
Today
COGT Crosses Above Average Analyst Target. In recent trading shares of Cogent Biosciences Inc (Symbol: COGT) have crossed above the average analyst 12-month target price of $22.92 changing hands for $32.46/share. When a stock reaches the target an analyst has set the analyst logically has two ways to react: downgrade
Today
Cogent Biosciences Inc. (COGT) Discusses Positive Phase 3 PEAK Trial Results of Bezuclastinib in Gastrointestinal Stromal Tumors - Slideshow.
Mon Nov 10, 2025
Cogent Biosciences Inc. (COGT) Discusses Positive Phase 3 PEAK Trial Results of Bezuclastinib in Gastrointestinal Stromal Tumors Transcript.
Mon Nov 10, 2025
Cogent Biosciences Hits 7-Year High Up 119% On Its New Stomach Cancer Promise. Shares of Cogent Biosciences rocketed to a seven-year high Monday on enthusiasm for the companys experimental stomach cancer treatment.The post Cogent Biosciences Hits 7-Year High Up 119% On Its New Stomach Cancer Promise appeared first on Investor'.s Business Daily.
Mon Nov 10, 2025
Cogent Biosciences Shares Surge 135% After Strong Cancer Drug Trial Results . (RTTNews) - Cogent Biosciences (COGT) soared 135.02% to $34.83 up $20.01 after announcing positive clinical data for its investigational treatment bezuclastinib.
Mon Nov 10, 2025
Cogent Biosciences Hits 7-Year High Up 135% On Its New Stomach Cancer Promise. Shares of Cogent Biosciences rocketed to a seven-year high Monday on enthusiasm for the companys experimental stomach cancer treatment.The post Cogent Biosciences Hits 7-Year High Up 135% On Its New Stomach Cancer Promise appeared first on Investor'.s Business Daily.
Mon Nov 10, 2025
Noteworthy Monday Option Activity: COGT PGY HROW. Looking at options trading activity among components of the Russell 3000 index there is noteworthy activity today in Cogent Biosciences Inc (Symbol: COGT) where a total volume of 15629 contracts has been traded thus far today a contract volume which is representative of appr
Mon Nov 10, 2025
FIND US ON
Unlock the knowledge that 10,000+ subscribers already cherish. Join for exclusive insights and stay ahead in the stock game! Enter your email to receive daily alerts
In-depth stock analysis
Informed investment decisions
Stock market insights
Stock trading tips
COGT Stock trends
COGT Stock performance
COGT Stock analysis
COGT investment strategies
Disclaimer:
Past performance, whether from actual results or historical strategy tests, does not guarantee future success. The displayed outcomes are based on strategies not previously available to investors and do not depict the returns achieved by any specific investor.
The Readiness Indicators, Sentiment Indicators, and overall score are derived from a model retrospectively applied using historical data. This model relies on assumptions inherent to it, which may or may not be verifiable and carry potential risks, including losses.
Engaging in active trading may not be suitable for individuals with limited resources, minimal investment or trading experience, or a low-risk tolerance. Proceed with caution as your capital is exposed to risks.
Please note that no offer or solicitation to buy or sell securities, securities derivatives of future products of any kind, or any type of trading or invesment advise, recommendation or strategy, is made, given or endorsed by StocksRunner including any of their affiliates ("TS").
This information is provided for illustrative purposes only. You should not rely on any advice and/or information contained in this website and before making any investment decision. we recommend that you consider whether it is appropriate for your situation and seek appropriate financial, taxation and legal advice.