


Find new investment opportunities based on Market Sentiment Indicator. Manage watchlist risk with leading indicator of volatility See what influential analysts and investors are saying about stocks in My Watchlist

Armada Hoffler Prope
$6.63
-0.90%
Set Alerts
Overview
Comments
Insights
Risks
Rating
Chart
Analysts
Street
Sentiment
Headlines
Most Trending
-6.02%
+1.82%
-0.74%
-3.43%
AHH
Armada Hoffler Prope
$6.63
Set Alerts
Overview
Comments
Insights
Risks
Rating
Chart
Analysts
Street
Sentiment
Headlines

52W High
$10.26
MKT CAP
$687.36M
52W Low
$6.01
VOL
$579.38K
P/E Ratio
34.95
AVG VOL
$1.00M
RSI
49.41
TREND
Sideways
BQ Stock IQ
Strengths

Trading below its fair value
Investors confidence is positive
Upgraded on attractively valued
Earnings are forecast to grow
AHH Price Performance
$6.87 (-3.49%)
$6.72 (-1.34%)
$7.09 (-6.49%)
$9.85 (-32.69%)
1year
6month
3month
1month
AHH Risk Level
AHH has Low risk level based on volatility, sector strength, volume, investor confidence and outlook.
Click here to check what is your level of risk
Risks Indicators

Beta greater than 1.0
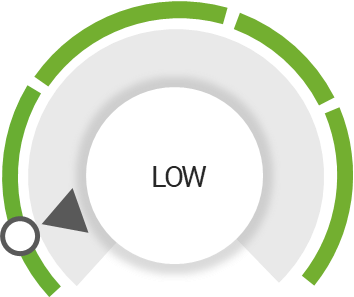
Low
LOW
HIGH
AHH Analysts Opinion
AHH overall standing based on key factors, offering insights into analysts perspectives and market expectations.
![]() Hover over the category for more information
Hover over the category for more information
Earnings
×
Earnings
Rating
×
Rating
Upgraded on attractively valued
Momentum
×
Momentum
Activity
×
Activity
Investors confidence is positive
Future
×
Future
Trading below its fair value
Earnings are forecast to grow
AHH Street Sentiment
Analysts perspectives on the stock desirability, trend direction and growth potential
0%
Buy
Opinion
Opinion
Trend
Score
Score
Potential
Score
Score
Consensus Rating
NA
NA
NA
AHH Performance Sentiment
Sentiments overview associated with AHH events and the stock performance.
0%
0%
Positive
Negative
No Events Found
events present
events present
events present
Very Bullish
Bullish
Neutral
Bearish
Very Bearish
Bullish
Neutral
Bearish
Very Bearish
AHH Latest Analysis +
FAQ About AHH Stock Insights
What is AHH current stock price?
What are AHH stock strengths?
What is AHH Risk Level?
What is AHH market cap and volume?
What is AHH current Stock IQ?
Should I buy AHH stock right now?
Is AHH a Strong Buy right now?
What does a 'Strong Buy' rating mean for AHH?
What does a 'Strong Sell' rating mean for AHH?
What factors influence AHH's Stock IQ?
Explore our AHH Stock insights
- In-Depth Market Analysis and Trends
- Expert Insights on Market Dynamics
- Tailored AHH Stock Strategies
- Effective Risk Management
FIND US ON


Receive our AHH Daily Alerts
Join over 10,000+ subscribers who value exclusive insights. Stay ahead in the stock market! Enter your email for daily alerts
Market Trends
Investment Insights
Stock Analysis
About StocksRunner
Stay ahead of the market
Market trends
Investment tips
Market analysis service
Future potential
Informed investment decisions
Investment analysis
IInvestment strategies
In-depth stock analysis
Performance analysis
Stock market insights
Financial trends analysis

 Overview
 Trending
 Screener
 Insights
 Top Rated
 Momentum
 Leaders